/* Put rfMaxima.mac in the same directory as this notebook, or add its
   directory to file_search_maxima. */
load("rfMaxima.mac")$Waveguide Loss (TE-10 Mode)
Generated from WAVEGUIDE.wxm with rfMaxima 0.2.5 on Maxima 5.46.0.
All results were computed by executing the notebook; none is transcribed.
(See "A W-band waveguide fabricated using selective laser melting, by K. Van Caekenberghe et al., Wiley Microwave and Optical Technology Letters, vol. 54, no. 11, p. 2572–2575, Nov. 2012)
Constants
%epsilon_0:8.854e-12$
%mu_0:4*%pi*1e-7$
%eta:float(sqrt(%mu_0/%epsilon_0));
c:float(sqrt(1/(%epsilon_0*%mu_0)));
k(f):=2*%pi*f/c;Design Characteristics
Material Parameters
%sigma_Au:41000410$
%sigma_Cu:5.8e7$
%sigma_Ti6Al4V:5.8e5$
R_q:1.25e-6$
Waveguide Dimensions
WR-28 26.5-40 GHz 0.28 x 0.14 inch WR-10 75-110 GHz 0.1 x 0.05 inch WR-3 220-325 GHz 0.034 x 0.017 inch
a:0.1*0.0254$
b:0.05*0.0254$
t:0.01*0.0254$
f_0:94e9$
Complex Propagation Constant, Wave Impedance
Note on units: the neper-to-decibel conversion factor is 20/ln(10) = 8.686. rfMaxima 0.2.4 used 8.868 here, which overstated every quoted dB/m figure by 2.1 %.
%lambda_c:2*a;
f_c:c/(2*a);
%delta(%mu,%sigma,%omega):=sqrt(2/(%omega*%mu*%sigma));
R_s(%delta,%sigma):=1/(%sigma*%delta);
define(%alpha(%mu,%sigma,f),block(
    [%delta],
    %delta:%delta(%mu,%sigma,2*%pi*f),
    ratsimp(R_s(%delta,%sigma)/(a^3*b*%beta(f)*k(f)*%eta)*(2*b*%pi^2+a^3*k(f)^2))));
%beta(f):=sqrt(k(f)^2-(%pi/a)^2);
Z_TE10(f):=k(f)*%eta/%beta(f);Figures of Merit without Surface Roughness
wxplot2d(%delta(%mu_0,%sigma_Ti6Al4V,2*%pi*f*1e9),
    [f,1,100],
    [logx],
    [legend,false],
    [xlabel,"Frequency [GHz]"],
    [ylabel,"%delta [m]"],
    [style,[lines,3,11]],
    [gnuplot_preamble,"set grid"])$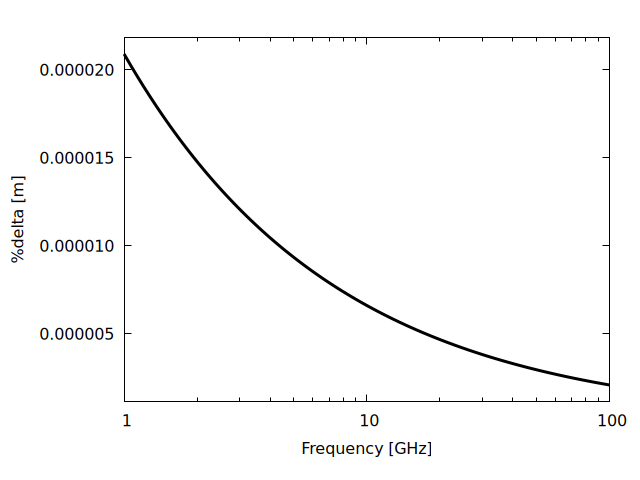
wxplot2d(8.686*%alpha(%mu_0,%sigma_Ti6Al4V,f*1e9),
    [f,75,110],
    [legend,false],
    [xlabel,"Frequency [GHz]"],
    [ylabel,"%alpha [dB/m]"],
    [style,[lines,3,11]],
    [gnuplot_preamble,"set grid"])$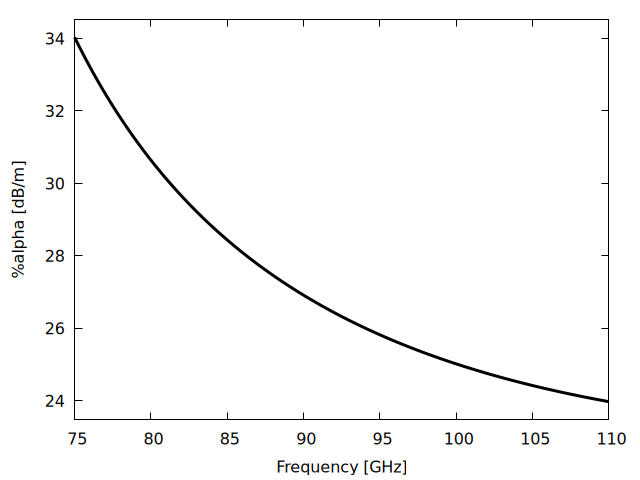
wxplot2d(%beta(f*1e9),
    [f,75,110],
    [legend,false],
    [xlabel,"Frequency [GHz]"],
    [ylabel,"%beta [rad/m]"],
    [style,[lines,3,11]],
    [gnuplot_preamble,"set grid"])$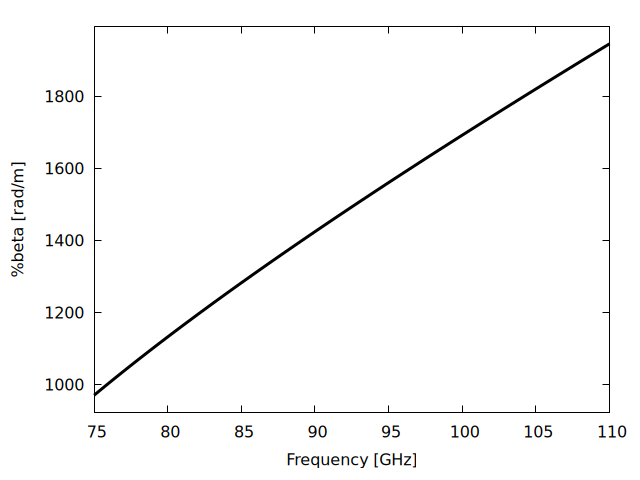
wxplot2d(Z_TE10(f*1e9),
    [f,75,110],
    [legend,false],
    [xlabel,"Frequency [GHz]"],
    [ylabel,"Z_TE10 [Ohm]"],
    [style,[lines,3,11]],
    [gnuplot_preamble,"set grid"])$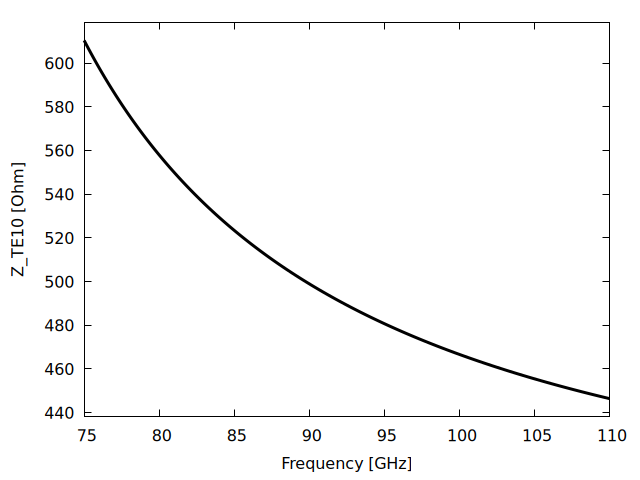
Figures of Merit with Surface Roughness
References:
- Ansoft HFSS 11, HFSS Online Help - Technical Notes, p 16-84
K_w(%delta,R_q):=1+exp(-(%delta/(2*R_q))^1.6);
%sigma_c(%sigma,K_w):=%sigma/K_w^2;f_c;
float(Z_TE10(f_0));
float(%delta(%mu_0,%sigma_Ti6Al4V,2*%pi*f_0));
float(R_s(%delta(%mu_0,%sigma_Ti6Al4V,2*%pi*f_0),%sigma_Ti6Al4V));
float(8.686*%alpha(%mu_0,%sigma_Ti6Al4V,f_0));
float(K_w(%delta(%mu_0,%sigma_Ti6Al4V,2*%pi*f_0),R_q));
float(%sigma_Ti6Al4V_rough:%sigma_c(%sigma_Ti6Al4V,K_w(%delta(%mu_0,%sigma_Ti6Al4V,2*%pi*f_0),R_q)))$
float(R_s(%delta(%mu_0,%sigma_Ti6Al4V,2*%pi*f_0),%sigma_Ti6Al4V_rough));
float(8.686*%alpha(%mu_0,%sigma_Ti6Al4V_rough,f_0));wxplot2d([%sigma_Ti6Al4V,%sigma_c(%sigma_Ti6Al4V,K_w(%delta(%mu_0,%sigma_Ti6Al4V,2*%pi*f),R_q))],
[f,1e6,1e11],
[logx],
[legend,false],
[xlabel,"Frequency [Hz]"],
[ylabel,"%sigma [S/m]"],
[style,[lines,3,1],[lines,3,2]],
[gnuplot_preamble,"set grid"])$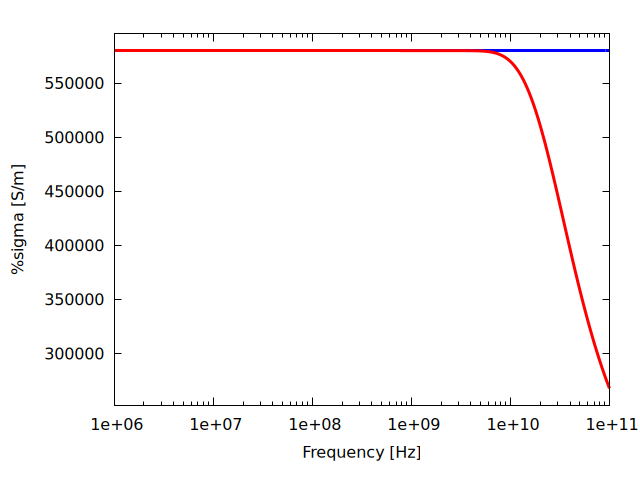
wxplot2d([8.686*%alpha(%mu_0,%sigma_Ti6Al4V,f*1e9),8.686*%alpha(%mu_0,%sigma_c(%sigma_Ti6Al4V,K_w(%delta(%mu_0,%sigma_Ti6Al4V,2*%pi*f*1e9),R_q)),f*1e9)],
    [f,75,110],
    [legend,false],
    [xlabel,"Frequency [GHz]"],
    [ylabel,"%alpha [dB/m]"],
    [style,[lines,3,11]],
    [gnuplot_preamble,"set grid"])$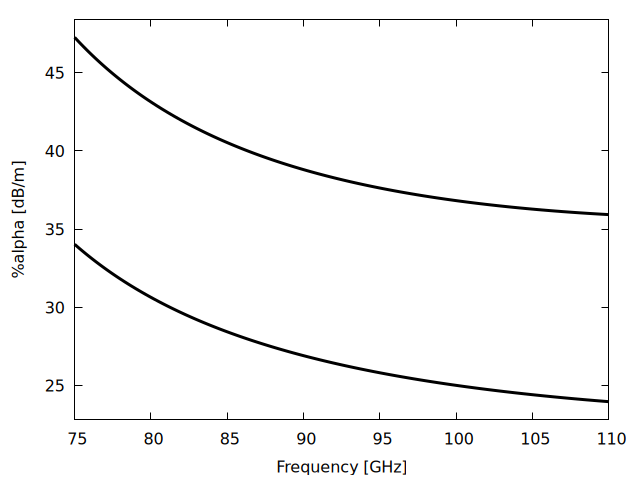
S-Parameters
l:0.05$

/* Reference impedance for the S-parameters.  0.2.4 set Z_0 := Z_TE10(f),
   i.e. it referred the line to its own characteristic impedance at every
   frequency.  That forces S11 = 0 identically, so the S11 Smith chart was a
   single point at the origin.  Refer instead to the TE10 wave impedance at
   band centre, which is what a fixed-impedance measurement sees.
   Note the LOCAL Z_0 in the block: 0.2.4 clobbered the global Z_0. */
Z_REF:float(Z_TE10(f_0));

define(S_WG(f),
    block([Z_0],
        Z_0:Z_REF,
        ABCD2S(
            ABCD_LossyTL(
                %alpha(%mu_0,%sigma_c(%sigma_Ti6Al4V,K_w(%delta(%mu_0,%sigma_Ti6Al4V,2*%pi*f),R_q)),f)+%i*%beta(f),
                l,
Z_TE10(f)))))$realpart(S_WG(f)) and imagpart(S_WG(f)) are symbolic expressions of roughly 300 000 characters, and plot2d re-does symbolic work at every sample point, so plotting them parametrically never finishes. Evaluate the S-parameter NUMERICALLY at each frequency first and plot the resulting point list: one evaluation is about 50 ms, so a hundred points take a few seconds.
S_WG_points(i,j,f1,f2,n):=makelist(
    block([z:ev(S_WG(fr)[i,j], numer)], [realpart(z), imagpart(z)]),
    fr, makelist(f1+(f2-f1)*kk/n, kk, 0, n))$
S11_pts:S_WG_points(1,1,75e9,110e9,100)$
S21_pts:S_WG_points(2,1,75e9,110e9,100)$
PlotSmithChart([discrete, S11_pts]);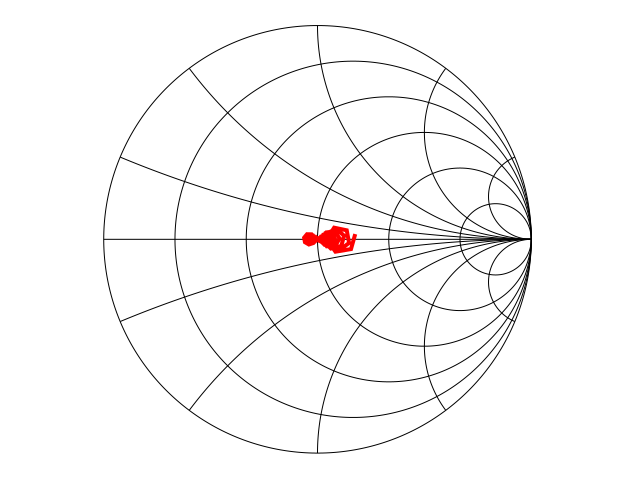
/* S21 is a TRANSMISSION coefficient; a Smith chart maps REFLECTION
   coefficient, so plot insertion loss against frequency instead -- again
   from the numerically evaluated points, for the reason given above. */
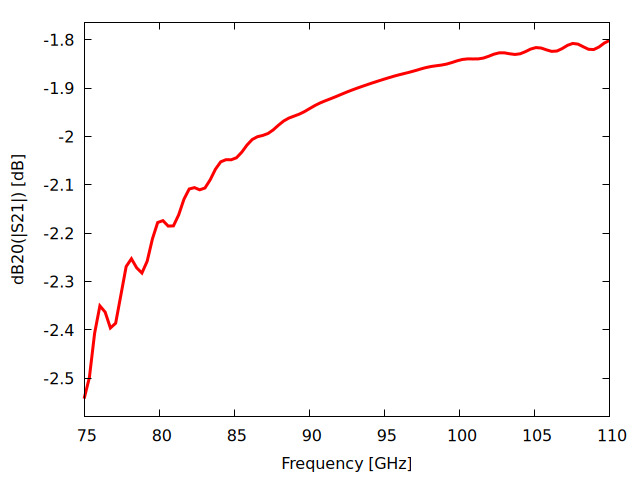
S21_dB:makelist([75+(110-75)*kk/100,
                 20*log10(sqrt(S21_pts[kk+1][1]^2+S21_pts[kk+1][2]^2))],
                kk, 0, 100)$
wxplot2d([discrete, S21_dB],
    [legend,false],
    [xlabel,"Frequency [GHz]"],
    [ylabel,"dB20(|S21|) [dB]"],
    [style,[lines,3,2]],
    [gnuplot_preamble,"set grid"]);