| (%i1) | load("/home/vcaeken/Desktop/rfMaxima.mac")$ |

SPNT Switch Notebook
| (%i2) |
declare(R_ON,real)$ declare(C_OFF,real)$ declare(Z_0,real)$ assume(R_ON>0)$ assume(C_OFF>0)$ assume(Z_0>0)$ |
1 SPNT Series Switch
Assume an IGFET (NMOS, pHEMT) SPNT shunt switch implementation,
in which an ON leg has an R_ON series resistance, and an OFF leg
has a C_OFF series capacitance. All ports are terminated in a Z_0
port impedance.
1.1 Equivalent Impedances
| (%i8) |
Z_OFF_LEG:1/(s*C_OFF)+Z_0; ((N-1)*Z_OFF_LEG^(-1))^(-1); |
1.2 Insertion Loss
| (%i10) |
Solution:linsolve([ i_in+i_out=i_1, v_in-v_out=-R_ON*i_out, v_in=Z_OFF_LEG/(N-1)*i_1], [i_in,i_out,i_1]); TwoPortMatrices(Solution); SParameters(S); |
| (%i13) | IL(%omega):=-20*log10(Abs_S21(%omega)); |

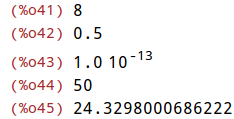
| (%i14) |
N:8; R_ON:0.5; C_OFF:100e-15; Z_0:50; float(IL(2*%pi*2e9)); |
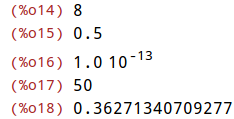
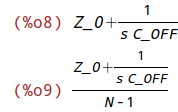
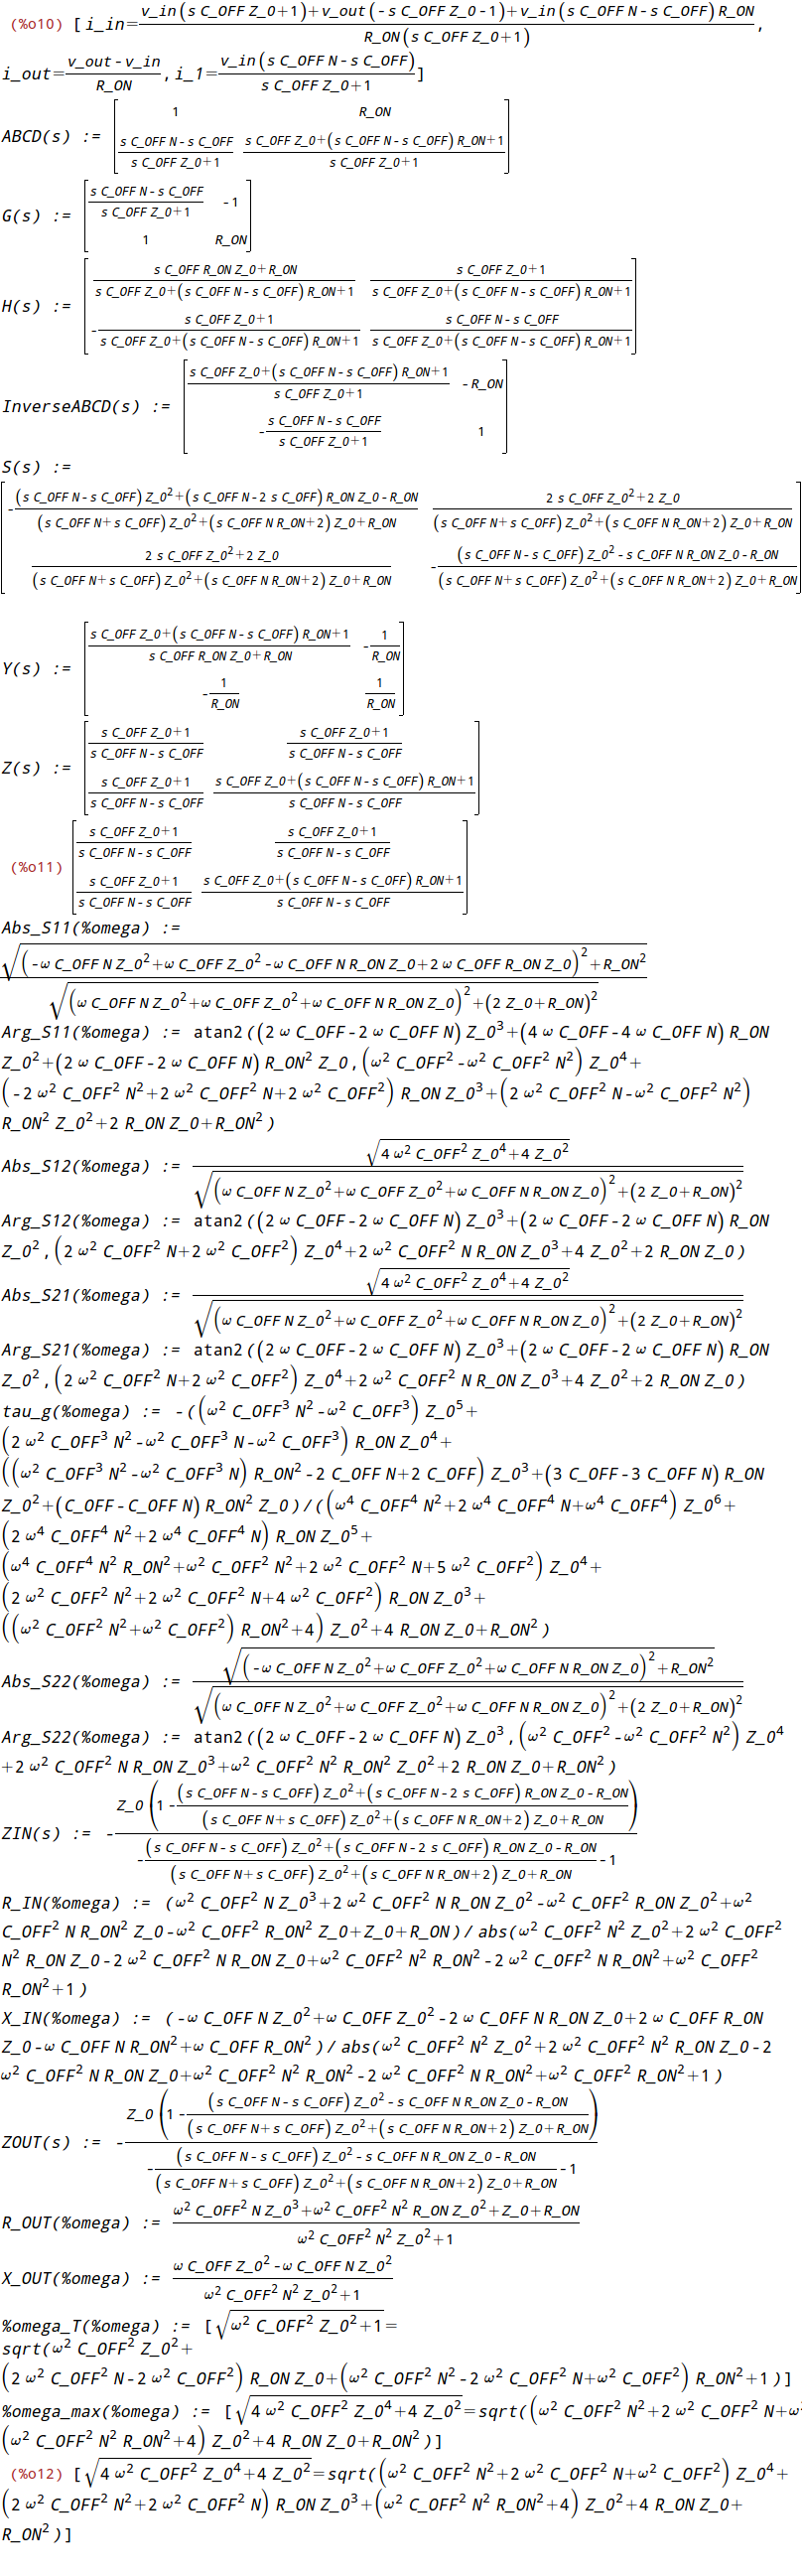
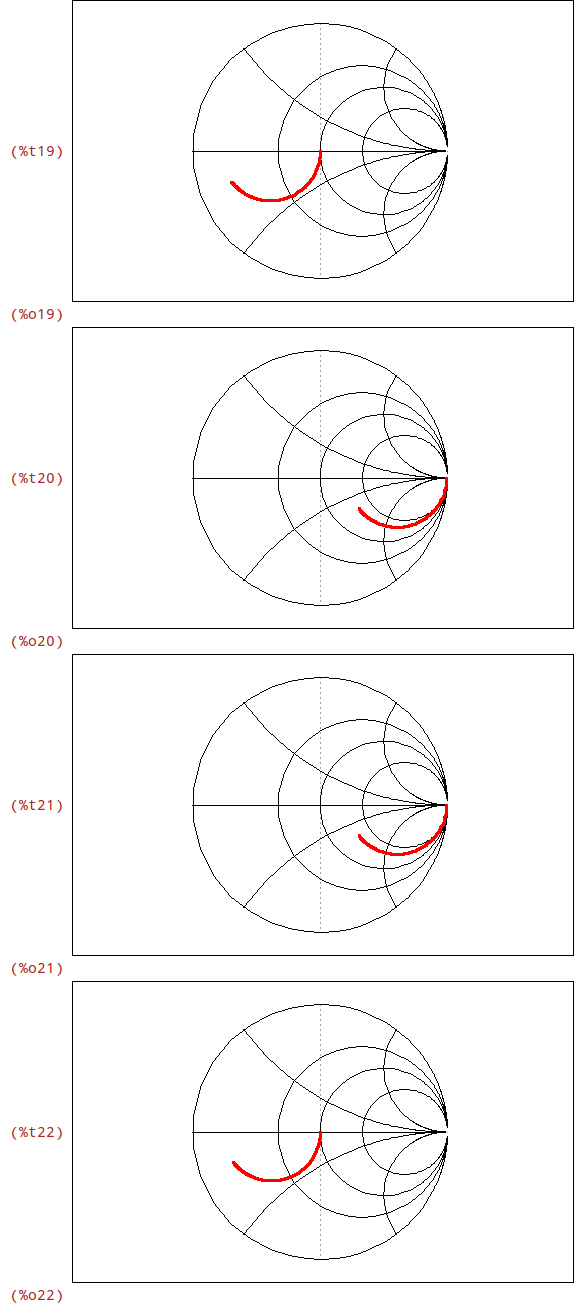
| (%i19) |
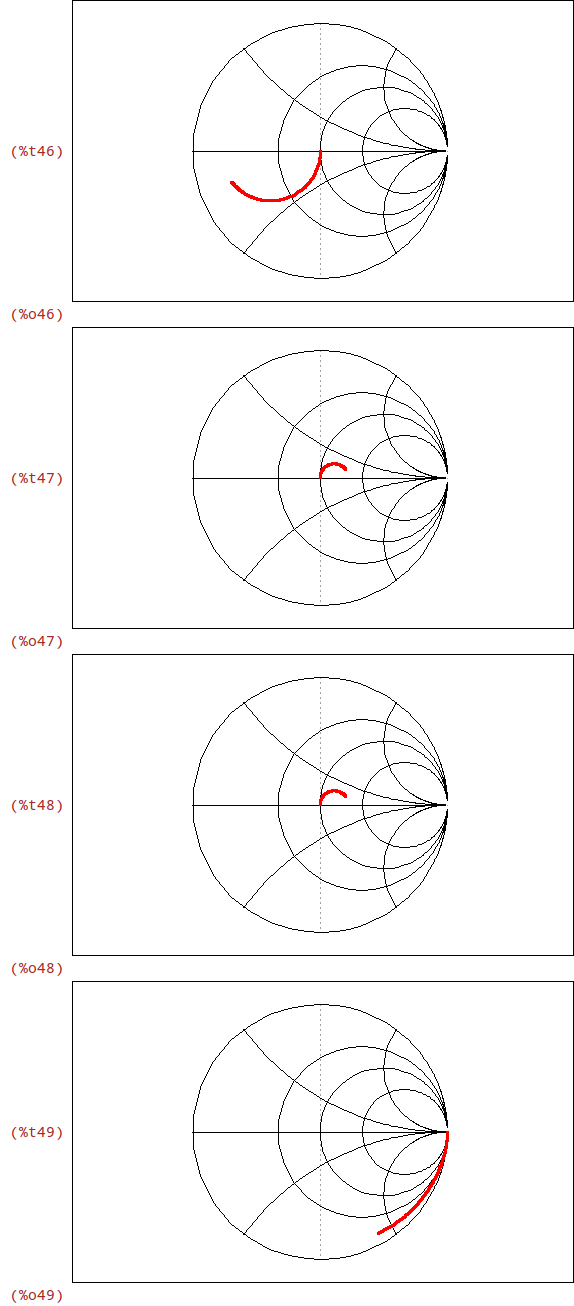
PlotSmithChart([ parametric, realpart(S(%i*2*%pi*f)[1,1]), imagpart(S(%i*2*%pi*f)[1,1]), [f,1e6,20e9], [nticks,100]]); PlotSmithChart([ parametric, realpart(S(%i*2*%pi*f)[1,2]), imagpart(S(%i*2*%pi*f)[1,2]), [f,1e6,20e9], [nticks,100]]); PlotSmithChart([ parametric, realpart(S(%i*2*%pi*f)[2,1]), imagpart(S(%i*2*%pi*f)[2,1]), [f,1e6,20e9], [nticks,100]]); PlotSmithChart([ parametric, realpart(S(%i*2*%pi*f)[2,2]), imagpart(S(%i*2*%pi*f)[2,2]), [f,1e6,20e9], [nticks,100]]); |
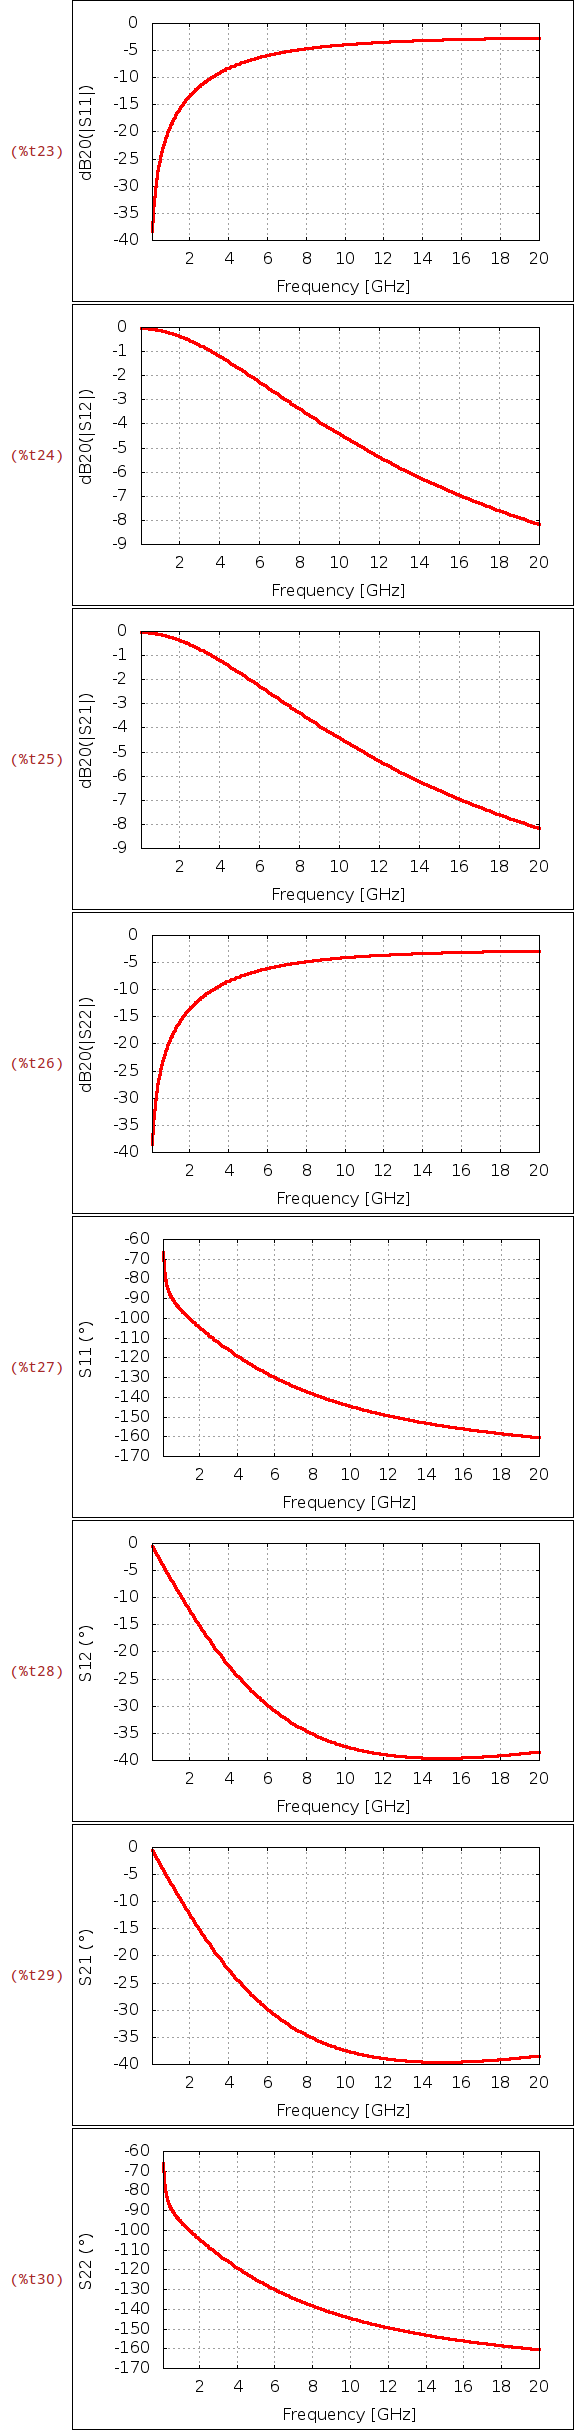
| (%i23) |
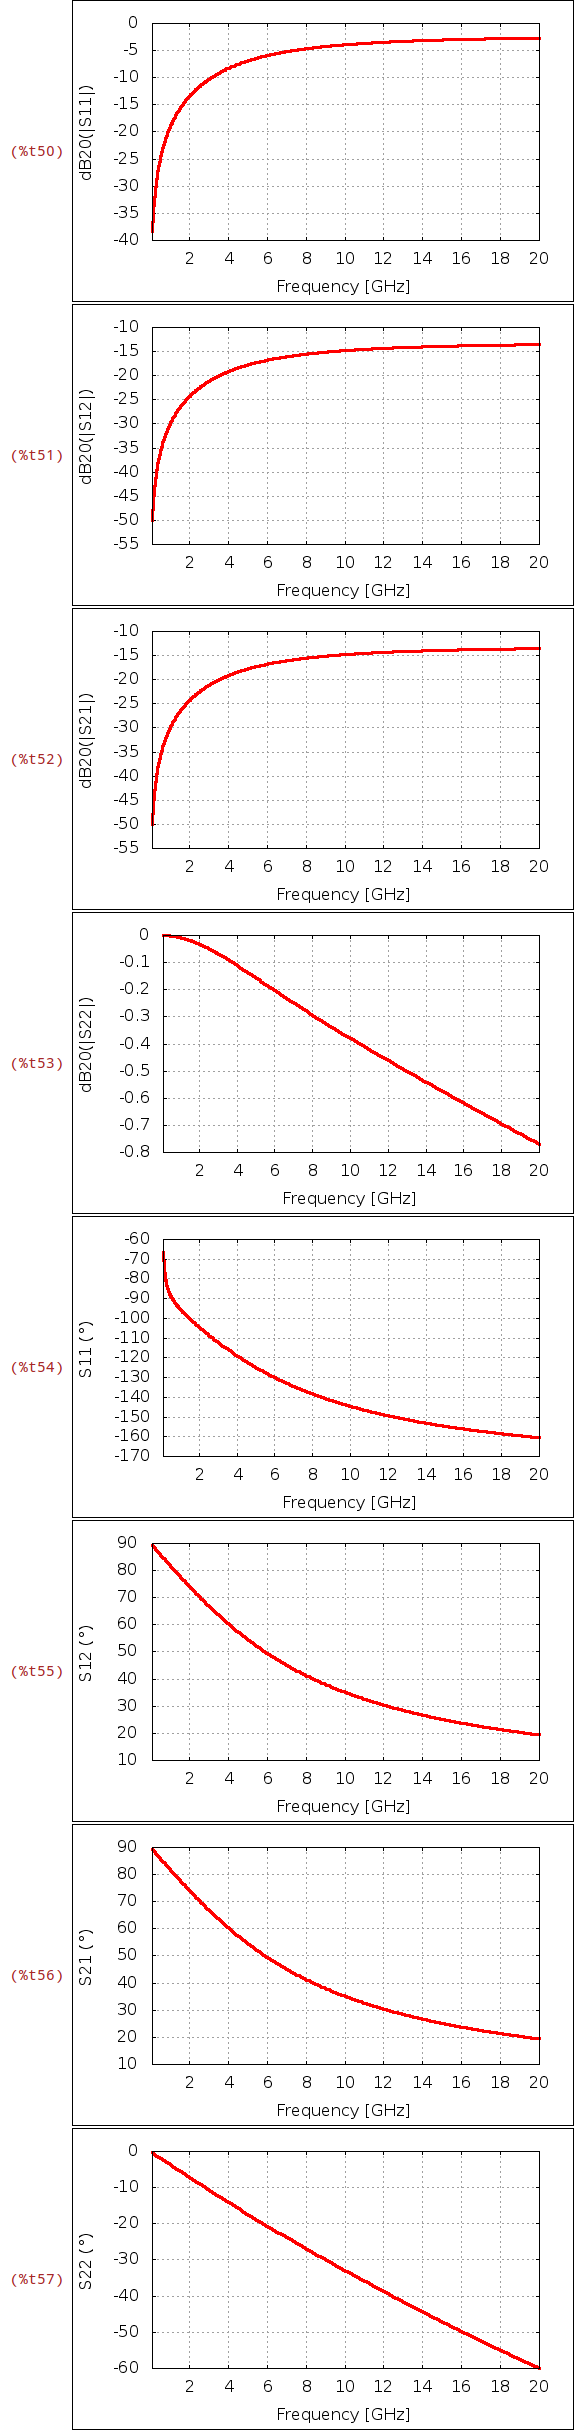
wxplot2d(ev(20*log10(Abs_S11(2*%pi*f*1e9))), [f,0.1,20], [legend,false], [xlabel,"Frequency [GHz]"], [ylabel,"dB20(|S11|)"], [style,[lines,3,2]], [gnuplot_preamble,"set grid"])$ wxplot2d(ev(20*log10(Abs_S12(2*%pi*f*1e9))), [f,0.1,20], [legend,false], [xlabel,"Frequency [GHz]"], [ylabel,"dB20(|S12|)"], [style,[lines,3,2]], [gnuplot_preamble,"set grid"])$ wxplot2d(ev(20*log10(Abs_S21(2*%pi*f*1e9))), [f,0.1,20], [legend,false], [xlabel,"Frequency [GHz]"], [ylabel,"dB20(|S21|)"], [style,[lines,3,2]], [gnuplot_preamble,"set grid"])$ wxplot2d(ev(20*log10(Abs_S22(2*%pi*f*1e9))), [f,0.1,20], [legend,false], [xlabel,"Frequency [GHz]"], [ylabel,"dB20(|S22|)"], [style,[lines,3,2]], [gnuplot_preamble,"set grid"])$ wxplot2d(ev(Arg_S11(2*%pi*f*1e9)*180/%pi), [f,0.1,20], [legend,false], [xlabel,"Frequency [GHz]"], [ylabel,"S11 (°)"], [style,[lines,3,2]], [gnuplot_preamble,"set grid"])$ wxplot2d(ev(Arg_S12(2*%pi*f*1e9)*180/%pi), [f,0.1,20], [legend,false], [xlabel,"Frequency [GHz]"], [ylabel,"S12 (°)"], [style,[lines,3,2]], [gnuplot_preamble,"set grid"])$ wxplot2d(ev(Arg_S21(2*%pi*f*1e9)*180/%pi), [f,0.1,20], [legend,false], [xlabel,"Frequency [GHz]"], [ylabel,"S21 (°)"], [style,[lines,3,2]], [gnuplot_preamble,"set grid"])$ wxplot2d(ev(Arg_S22(2*%pi*f*1e9)*180/%pi), [f,0.1,20], [legend,false], [xlabel,"Frequency [GHz]"], [ylabel,"S22 (°)"], [style,[lines,3,2]], [gnuplot_preamble,"set grid"])$ |
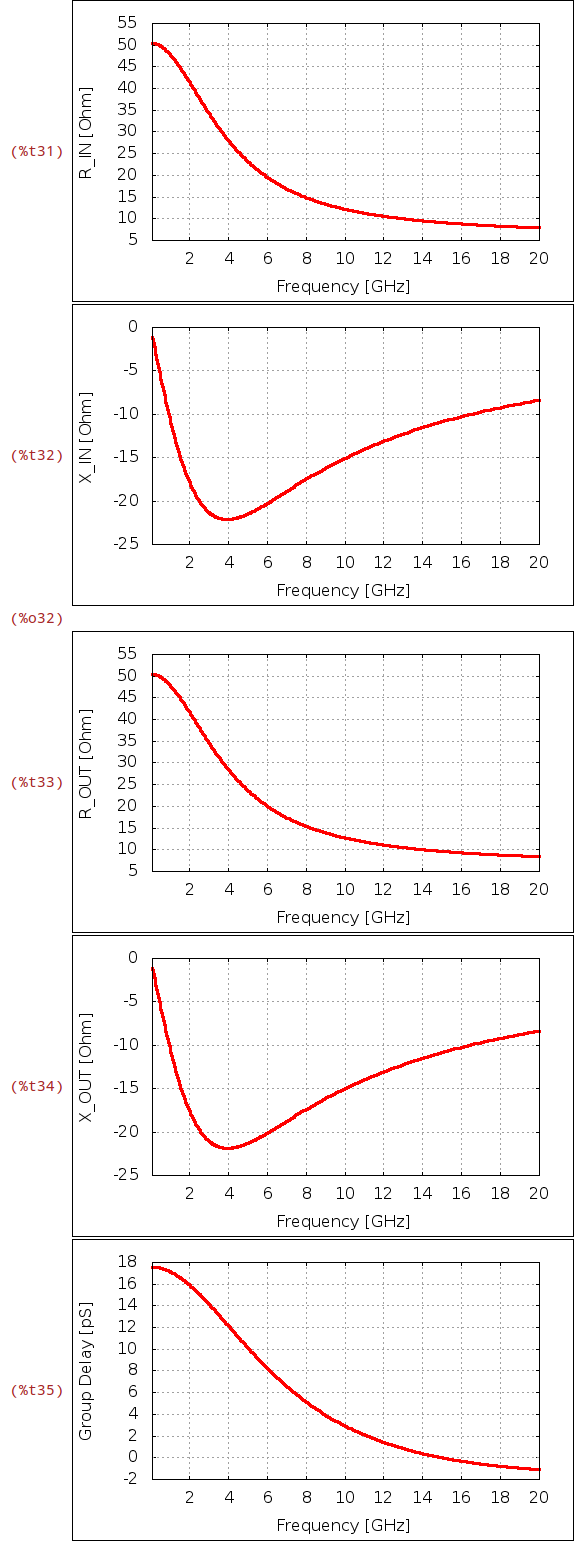
| (%i31) |
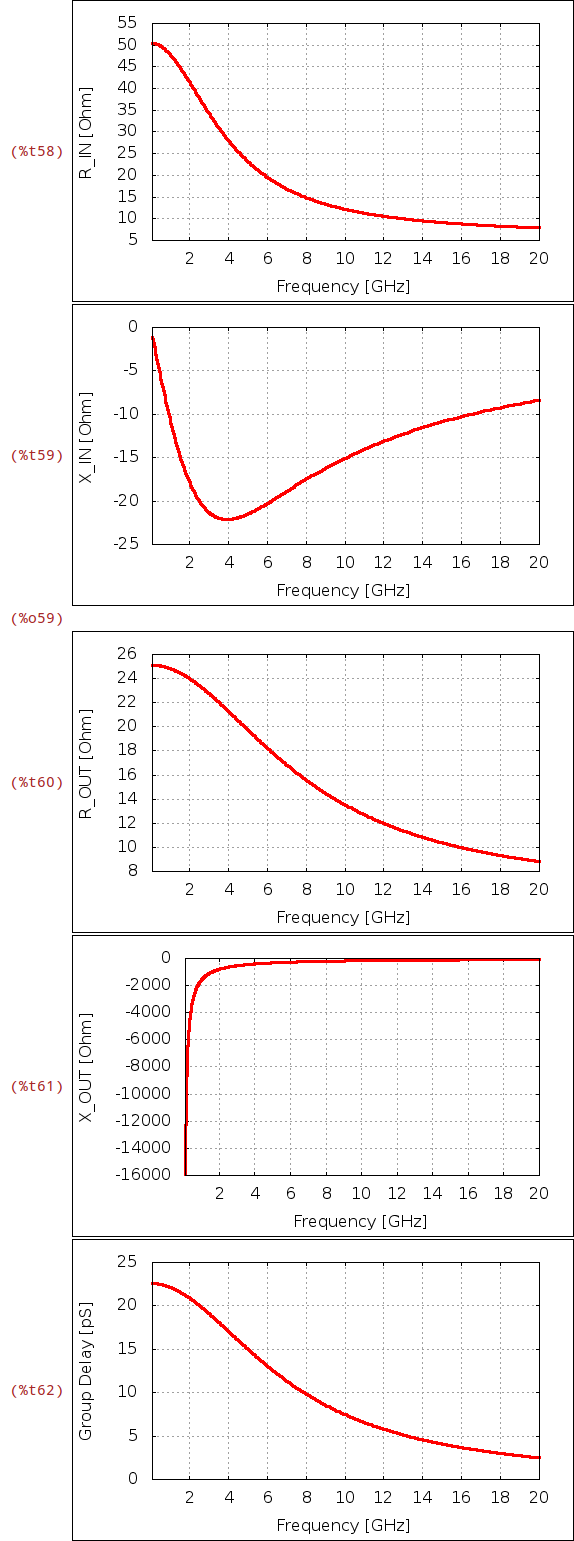
wxplot2d(ev((R_IN(2*%pi*f*1e9))), [f,0.1,20], [legend,false], [xlabel,"Frequency [GHz]"], [ylabel,"R_IN [Ohm]"], [style,[lines,3,2]], [gnuplot_preamble,"set grid"])$ wxplot2d(ev((X_IN(2*%pi*f*1e9))), [f,0.1,20], [legend,false], [xlabel,"Frequency [GHz]"], [ylabel,"X_IN [Ohm]"], [style,[lines,3,2]], [gnuplot_preamble,"set grid"]); wxplot2d(ev((R_OUT(2*%pi*f*1e9))), [f,0.1,20], [legend,false], [xlabel,"Frequency [GHz]"], [ylabel,"R_OUT [Ohm]"], [style,[lines,3,2]], [gnuplot_preamble,"set grid"])$ wxplot2d(ev((X_OUT(2*%pi*f*1e9))), [f,0.1,20], [legend,false], [xlabel,"Frequency [GHz]"], [ylabel,"X_OUT [Ohm]"], [style,[lines,3,2]], [gnuplot_preamble,"set grid"])$ wxplot2d(ev((tau_g(2*%pi*f*1e9))*1e12), [f,0.1,20], [legend,false], [xlabel,"Frequency [GHz]"], [ylabel,"Group Delay [pS]"], [style,[lines,3,2]], [gnuplot_preamble,"set grid"])$ |
| (%i36) | kill(N,R_ON,C_OFF,Z_0); |
1.3 Isolation
| (%i37) |
Solution:linsolve([ i_in+i_out=i_1+i_2, v_in-v_out=-i_out/(s*C_OFF), v_in=Z_OFF_LEG/(N-2)*i_1, v_in=(R_ON+Z_0)*i_2], [i_in,i_out,i_1,i_2]); TwoPortMatrices(Solution); SParameters(S); |
| (%i40) | ISOLATION(%omega):=-20*log10(Abs_S21(%omega)); |

| (%i41) |
N:8; R_ON:0.5; C_OFF:100e-15; Z_0:50; float(ISOLATION(2*%pi*2e9)); |
| (%i46) |
PlotSmithChart([ parametric, realpart(S(%i*2*%pi*f)[1,1]), imagpart(S(%i*2*%pi*f)[1,1]), [f,1e6,20e9], [nticks,100]]); PlotSmithChart([ parametric, realpart(S(%i*2*%pi*f)[1,2]), imagpart(S(%i*2*%pi*f)[1,2]), [f,1e6,20e9], [nticks,100]]); PlotSmithChart([ parametric, realpart(S(%i*2*%pi*f)[2,1]), imagpart(S(%i*2*%pi*f)[2,1]), [f,1e6,20e9], [nticks,100]]); PlotSmithChart([ parametric, realpart(S(%i*2*%pi*f)[2,2]), imagpart(S(%i*2*%pi*f)[2,2]), [f,1e6,20e9], [nticks,100]]); |
| (%i50) |
wxplot2d(ev(20*log10(Abs_S11(2*%pi*f*1e9))), [f,0.1,20], [legend,false], [xlabel,"Frequency [GHz]"], [ylabel,"dB20(|S11|)"], [style,[lines,3,2]], [gnuplot_preamble,"set grid"])$ wxplot2d(ev(20*log10(Abs_S12(2*%pi*f*1e9))), [f,0.1,20], [legend,false], [xlabel,"Frequency [GHz]"], [ylabel,"dB20(|S12|)"], [style,[lines,3,2]], [gnuplot_preamble,"set grid"])$ wxplot2d(ev(20*log10(Abs_S21(2*%pi*f*1e9))), [f,0.1,20], [legend,false], [xlabel,"Frequency [GHz]"], [ylabel,"dB20(|S21|)"], [style,[lines,3,2]], [gnuplot_preamble,"set grid"])$ wxplot2d(ev(20*log10(Abs_S22(2*%pi*f*1e9))), [f,0.1,20], [legend,false], [xlabel,"Frequency [GHz]"], [ylabel,"dB20(|S22|)"], [style,[lines,3,2]], [gnuplot_preamble,"set grid"])$ wxplot2d(ev(Arg_S11(2*%pi*f*1e9)*180/%pi), [f,0.1,20], [legend,false], [xlabel,"Frequency [GHz]"], [ylabel,"S11 (°)"], [style,[lines,3,2]], [gnuplot_preamble,"set grid"])$ wxplot2d(ev(Arg_S12(2*%pi*f*1e9)*180/%pi), [f,0.1,20], [legend,false], [xlabel,"Frequency [GHz]"], [ylabel,"S12 (°)"], [style,[lines,3,2]], [gnuplot_preamble,"set grid"])$ wxplot2d(ev(Arg_S21(2*%pi*f*1e9)*180/%pi), [f,0.1,20], [legend,false], [xlabel,"Frequency [GHz]"], [ylabel,"S21 (°)"], [style,[lines,3,2]], [gnuplot_preamble,"set grid"])$ wxplot2d(ev(Arg_S22(2*%pi*f*1e9)*180/%pi), [f,0.1,20], [legend,false], [xlabel,"Frequency [GHz]"], [ylabel,"S22 (°)"], [style,[lines,3,2]], [gnuplot_preamble,"set grid"])$ |
| (%i58) |
wxplot2d(ev((R_IN(2*%pi*f*1e9))), [f,0.1,20], [legend,false], [xlabel,"Frequency [GHz]"], [ylabel,"R_IN [Ohm]"], [style,[lines,3,2]], [gnuplot_preamble,"set grid"])$ wxplot2d(ev((X_IN(2*%pi*f*1e9))), [f,0.1,20], [legend,false], [xlabel,"Frequency [GHz]"], [ylabel,"X_IN [Ohm]"], [style,[lines,3,2]], [gnuplot_preamble,"set grid"]); wxplot2d(ev((R_OUT(2*%pi*f*1e9))), [f,0.1,20], [legend,false], [xlabel,"Frequency [GHz]"], [ylabel,"R_OUT [Ohm]"], [style,[lines,3,2]], [gnuplot_preamble,"set grid"])$ wxplot2d(ev((X_OUT(2*%pi*f*1e9))), [f,0.1,20], [legend,false], [xlabel,"Frequency [GHz]"], [ylabel,"X_OUT [Ohm]"], [style,[lines,3,2]], [gnuplot_preamble,"set grid"])$ wxplot2d(ev((tau_g(2*%pi*f*1e9))*1e12), [f,0.1,20], [legend,false], [xlabel,"Frequency [GHz]"], [ylabel,"Group Delay [pS]"], [style,[lines,3,2]], [gnuplot_preamble,"set grid"])$ |
| (%i63) | kill(N,R_ON,C_OFF,Z_0); |
2 SPNT Shunt Switch
Assume an IGFET (NMOS, pHEMT) SPNT shunt switch implementation,
in which an ON leg consists of a quarter wave t-line and a shunt
C_OFF capacitance, and an OFF leg consists of a quarter wave t-line
and a shunt R_ON resistance. All ports are terminated in a Z_0
port impedance.
2.1 Equivalent Impedances
| (%i64) |
declare(l,real)$ assume(l>0)$ |
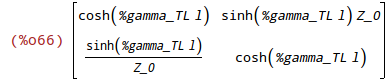
| (%i66) | ABCD:ABCD_LossyTL(%gamma_TL,l,Z_0); |
| (%i67) |
Solution:linsolve([ v_1=cosh(%gamma_TL*l)*v_2+Z_0*sinh(%gamma_TL*l)*i_2, i_1=sinh(%gamma_TL*l)/Z_0*v_2+cosh(%gamma_TL*l)*i_2, v_2=(1/Z_0+s*C_OFF)^(-1)*i_2], [v_1,v_2,i_2]); Z_ON_LEG:ratsimp(ev(v_1,Solution)/i_1); |
| (%i69) |
Solution:linsolve([ v_1=cosh(%gamma_TL*l)*v_2+Z_0*sinh(%gamma_TL*l)*i_2, i_1=sinh(%gamma_TL*l)/Z_0*v_2+cosh(%gamma_TL*l)*i_2, v_2=(1/Z_0+1/R_ON)^(-1)*i_2], [v_1,v_2,i_2]); Z_OFF_LEG:ratsimp(ev(v_1,Solution)/i_1); ((N-1)*Z_OFF_LEG^(-1))^(-1); |
2.2 Insertion Loss
| (%i72) |
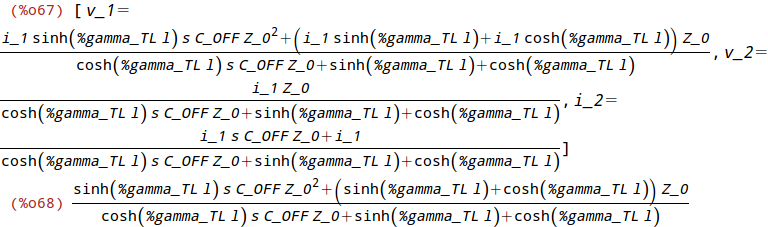
Solution:linsolve([ v_1=cosh(%gamma_TL*l)*v_2+Z_0*sinh(%gamma_TL*l)*i_2, i_1=sinh(%gamma_TL*l)/Z_0*v_2+cosh(%gamma_TL*l)*i_2, v_1=Z_OFF_LEG/(N-1)*i_3, v_in=v_1, i_in=i_1+i_3, v_out=v_2, i_out+i_2=i_4, v_out=1/(s*C_OFF)*i_4], [i_in,i_out,i_1,i_2,i_3,i_4,v_1,v_2]); TwoPortMatrices(Solution); |
| (%i74) |
%beta:%omega/c$ %gamma_TL:%i*%beta$ l:%lambda/4$ SParameters(S); |

| (%i78) |
%epsilon_r_Si:11.9$ c:float(300e6/sqrt(%epsilon_r_Si)); %lambda:float(c/2e9); |
| (%i81) | IL(%omega):=-20*log10(Abs_S21(%omega)); |

| (%i82) |
N:8$ R_ON:0.5$ C_OFF:100e-15$ Z_0:50$ float(IL(2*%pi*2e9)); |

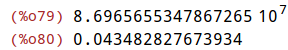
| (%i87) |
PlotSmithChart([ parametric, realpart(ev(S(%i*2*%pi*f)[1,1],%omega=2*%pi*f)), imagpart(ev(S(%i*2*%pi*f)[1,1],%omega=2*%pi*f)), [f,1e6,20e9], [nticks,100]]); PlotSmithChart([ parametric, realpart(ev(S(%i*2*%pi*f)[1,2],%omega=2*%pi*f)), imagpart(ev(S(%i*2*%pi*f)[1,2],%omega=2*%pi*f)), [f,1e6,20e9], [nticks,100]]); PlotSmithChart([ parametric, realpart(ev(S(%i*2*%pi*f)[2,1],%omega=2*%pi*f)), imagpart(ev(S(%i*2*%pi*f)[2,1],%omega=2*%pi*f)), [f,1e6,20e9], [nticks,100]]); PlotSmithChart([ parametric, realpart(ev(S(%i*2*%pi*f)[2,2],%omega=2*%pi*f)), imagpart(ev(S(%i*2*%pi*f)[2,2],%omega=2*%pi*f)), [f,1e6,20e9], [nticks,100]]); |
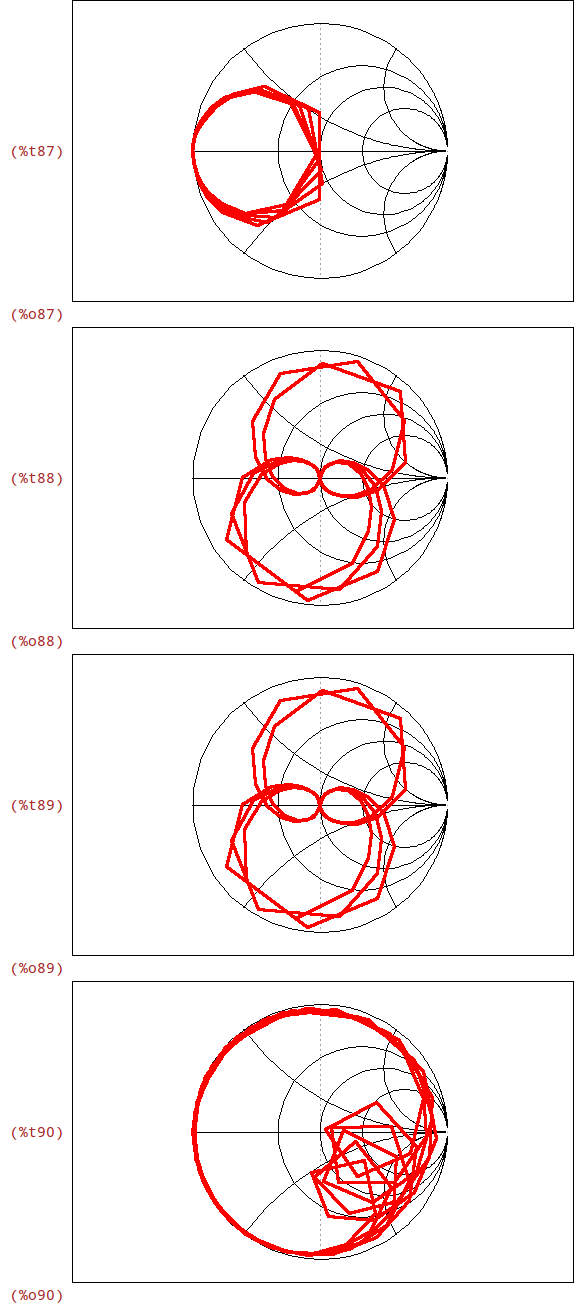
| (%i91) |
wxplot2d(ev(20*log10(Abs_S11(2*%pi*f*1e9))), [f,0.1,20], [legend,false], [xlabel,"Frequency [GHz]"], [ylabel,"dB20(|S11|)"], [style,[lines,3,2]], [gnuplot_preamble,"set grid"])$ wxplot2d(ev(20*log10(Abs_S12(2*%pi*f*1e9))), [f,0.1,20], [legend,false], [xlabel,"Frequency [GHz]"], [ylabel,"dB20(|S12|)"], [style,[lines,3,2]], [gnuplot_preamble,"set grid"])$ wxplot2d(ev(20*log10(Abs_S21(2*%pi*f*1e9))), [f,0.1,20], [legend,false], [xlabel,"Frequency [GHz]"], [ylabel,"dB20(|S21|)"], [style,[lines,3,2]], [gnuplot_preamble,"set grid"])$ wxplot2d(ev(20*log10(Abs_S22(2*%pi*f*1e9))), [f,0.1,20], [legend,false], [xlabel,"Frequency [GHz]"], [ylabel,"dB20(|S22|)"], [style,[lines,3,2]], [gnuplot_preamble,"set grid"])$ wxplot2d(ev(Arg_S11(2*%pi*f*1e9)*180/%pi), [f,0.1,20], [legend,false], [xlabel,"Frequency [GHz]"], [ylabel,"S11 (°)"], [style,[lines,3,2]], [gnuplot_preamble,"set grid"])$ wxplot2d(ev(Arg_S12(2*%pi*f*1e9)*180/%pi), [f,0.1,20], [legend,false], [xlabel,"Frequency [GHz]"], [ylabel,"S12 (°)"], [style,[lines,3,2]], [gnuplot_preamble,"set grid"])$ wxplot2d(ev(Arg_S21(2*%pi*f*1e9)*180/%pi), [f,0.1,20], [legend,false], [xlabel,"Frequency [GHz]"], [ylabel,"S21 (°)"], [style,[lines,3,2]], [gnuplot_preamble,"set grid"])$ wxplot2d(ev(Arg_S22(2*%pi*f*1e9)*180/%pi), [f,0.1,20], [legend,false], [xlabel,"Frequency [GHz]"], [ylabel,"S22 (°)"], [style,[lines,3,2]], [gnuplot_preamble,"set grid"])$ |
| (%i99) |
wxplot2d(ev((R_IN(2*%pi*f*1e9))), [f,0.1,20], [legend,false], [xlabel,"Frequency [GHz]"], [ylabel,"R_IN [Ohm]"], [style,[lines,3,2]], [gnuplot_preamble,"set grid"])$ wxplot2d(ev((X_IN(2*%pi*f*1e9))), [f,0.1,20], [legend,false], [xlabel,"Frequency [GHz]"], [ylabel,"X_IN [Ohm]"], [style,[lines,3,2]], [gnuplot_preamble,"set grid"]); wxplot2d(ev((R_OUT(2*%pi*f*1e9))), [f,0.1,20], [legend,false], [xlabel,"Frequency [GHz]"], [ylabel,"R_OUT [Ohm]"], [style,[lines,3,2]], [gnuplot_preamble,"set grid"])$ wxplot2d(ev((X_OUT(2*%pi*f*1e9))), [f,0.1,20], [legend,false], [xlabel,"Frequency [GHz]"], [ylabel,"X_OUT [Ohm]"], [style,[lines,3,2]], [gnuplot_preamble,"set grid"])$ wxplot2d(ev((tau_g(2*%pi*f*1e9))*1e12), [f,0.1,20], [legend,false], [xlabel,"Frequency [GHz]"], [ylabel,"Group Delay [pS]"], [style,[lines,3,2]], [gnuplot_preamble,"set grid"])$ |
| (%i104) | kill(%beta,%gamma_TL,%lambda,c,l,N,R_ON,C_OFF,Z_0); |

2.3 Isolation
| (%i105) |
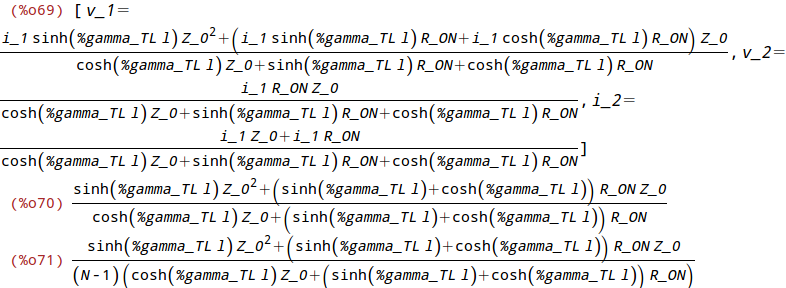
Solution:linsolve([ v_1=cosh(%gamma_TL*l)*v_2+Z_0*sinh(%gamma_TL*l)*i_2, i_1=sinh(%gamma_TL*l)/Z_0*v_2+cosh(%gamma_TL*l)*i_2, v_1=Z_OFF_LEG/(N-2)*i_3, v_1=Z_ON_LEG*i_4, v_in=v_1, i_in=i_1+i_3+i_4, v_out=v_2, i_out+i_2=i_5, v_out=R_ON*i_5], [i_in,i_out,i_1,i_2,i_3,i_4,i_5,v_1,v_2]); TwoPortMatrices(Solution); |
| (%i107) |
%beta:%omega/c$ %gamma_TL:%i*%beta$ l:%lambda/4$ SParameters(S); |

| (%i111) |
%epsilon_r_Si:11.9$ c:float(300e6/sqrt(%epsilon_r_Si)); %lambda:float(c/2e9); |
| (%i114) | ISOLATION(%omega):=-20*log10(Abs_S21(%omega)); |

| (%i115) |
N:8; R_ON:0.5; C_OFF:100e-15; Z_0:50; float(ISOLATION(2*%pi*2e9)); |
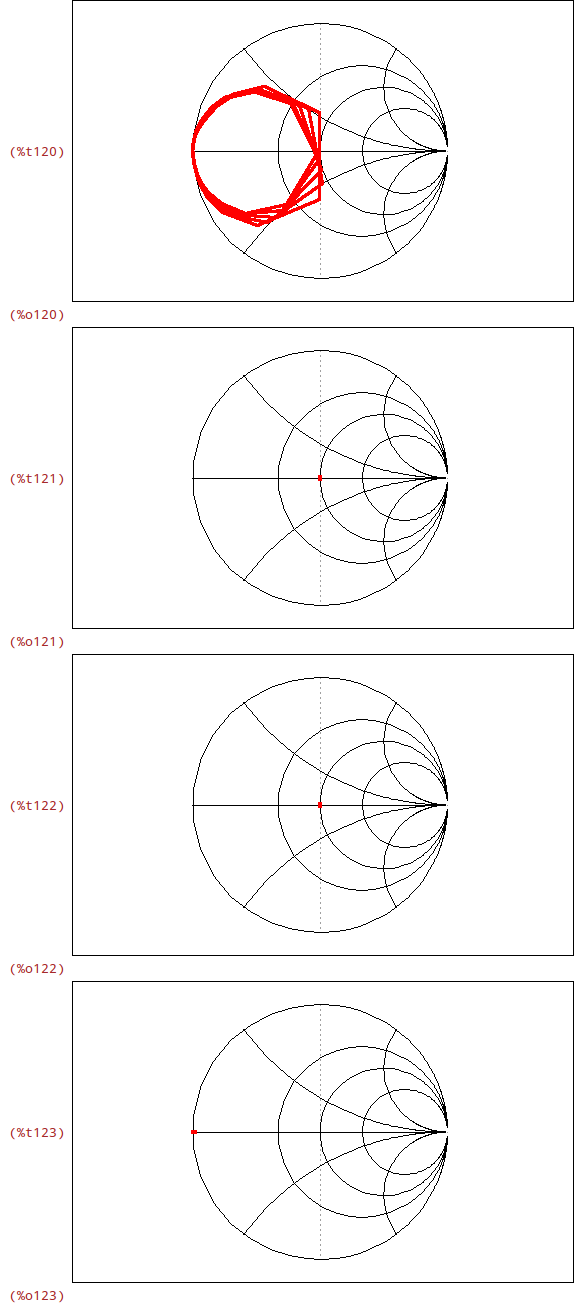
| (%i120) |
PlotSmithChart([ parametric, realpart(ev(S(%i*2*%pi*f)[1,1],%omega=2*%pi*f)), imagpart(ev(S(%i*2*%pi*f)[1,1],%omega=2*%pi*f)), [f,1e6,20e9], [nticks,100]]); PlotSmithChart([ parametric, realpart(ev(S(%i*2*%pi*f)[1,2],%omega=2*%pi*f)), imagpart(ev(S(%i*2*%pi*f)[1,2],%omega=2*%pi*f)), [f,1e6,20e9], [nticks,100]]); PlotSmithChart([ parametric, realpart(ev(S(%i*2*%pi*f)[2,1],%omega=2*%pi*f)), imagpart(ev(S(%i*2*%pi*f)[2,1],%omega=2*%pi*f)), [f,1e6,20e9], [nticks,100]]); PlotSmithChart([ parametric, realpart(ev(S(%i*2*%pi*f)[2,2],%omega=2*%pi*f)), imagpart(ev(S(%i*2*%pi*f)[2,2],%omega=2*%pi*f)), [f,1e6,20e9], [nticks,100]]); |
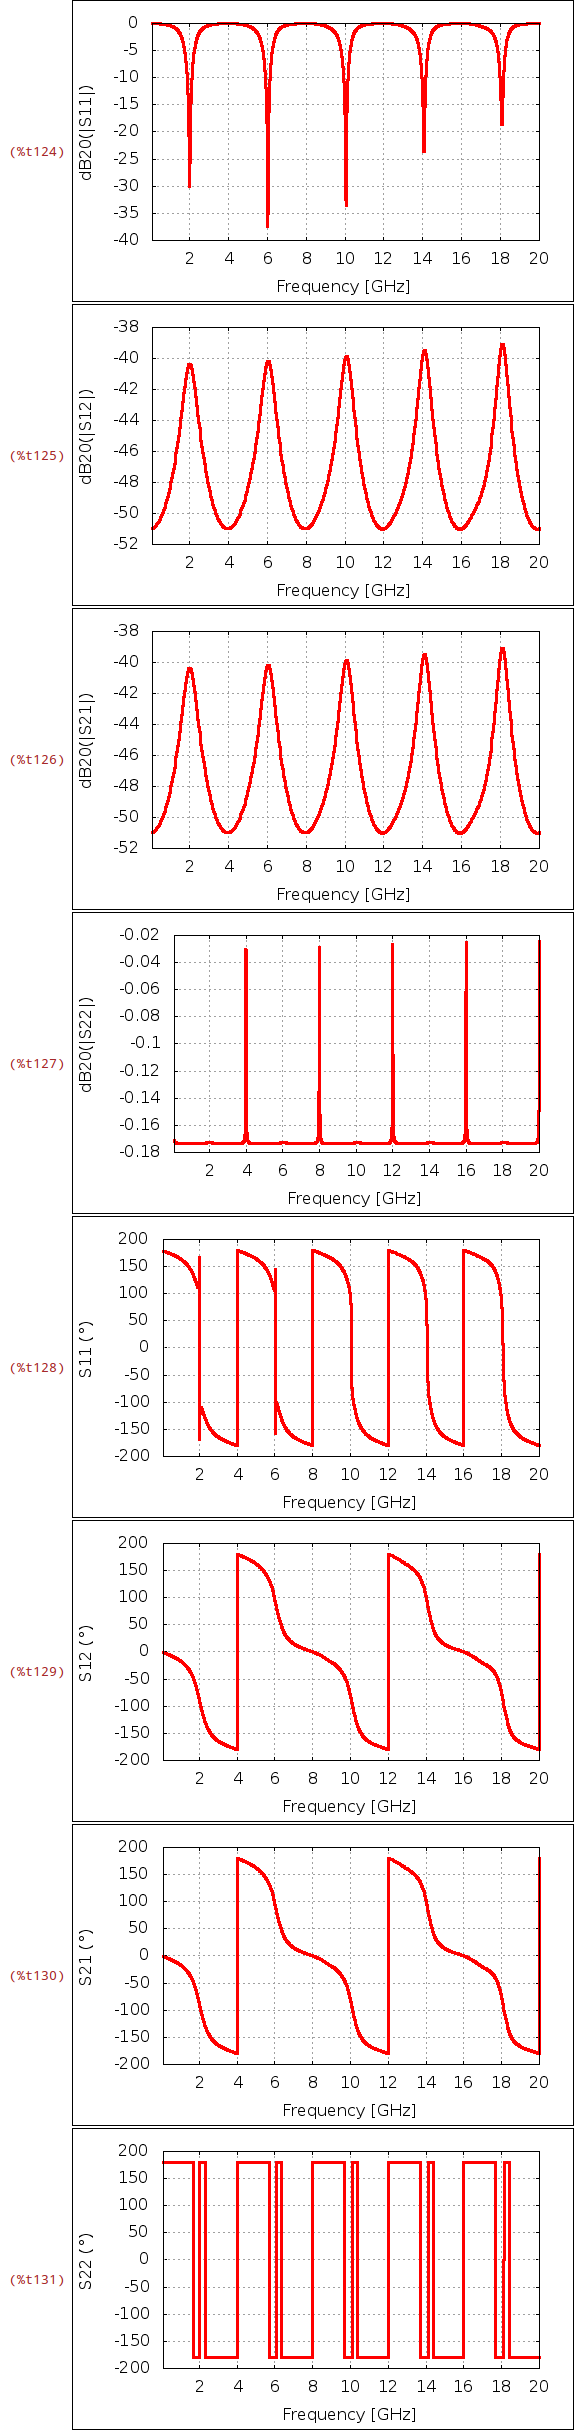
| (%i124) |
wxplot2d(ev(20*log10(Abs_S11(2*%pi*f*1e9))), [f,0.1,20], [legend,false], [xlabel,"Frequency [GHz]"], [ylabel,"dB20(|S11|)"], [style,[lines,3,2]], [gnuplot_preamble,"set grid"])$ wxplot2d(ev(20*log10(Abs_S12(2*%pi*f*1e9))), [f,0.1,20], [legend,false], [xlabel,"Frequency [GHz]"], [ylabel,"dB20(|S12|)"], [style,[lines,3,2]], [gnuplot_preamble,"set grid"])$ wxplot2d(ev(20*log10(Abs_S21(2*%pi*f*1e9))), [f,0.1,20], [legend,false], [xlabel,"Frequency [GHz]"], [ylabel,"dB20(|S21|)"], [style,[lines,3,2]], [gnuplot_preamble,"set grid"])$ wxplot2d(ev(20*log10(Abs_S22(2*%pi*f*1e9))), [f,0.1,20], [legend,false], [xlabel,"Frequency [GHz]"], [ylabel,"dB20(|S22|)"], [style,[lines,3,2]], [gnuplot_preamble,"set grid"])$ wxplot2d(ev(Arg_S11(2*%pi*f*1e9)*180/%pi), [f,0.1,20], [legend,false], [xlabel,"Frequency [GHz]"], [ylabel,"S11 (°)"], [style,[lines,3,2]], [gnuplot_preamble,"set grid"])$ wxplot2d(ev(Arg_S12(2*%pi*f*1e9)*180/%pi), [f,0.1,20], [legend,false], [xlabel,"Frequency [GHz]"], [ylabel,"S12 (°)"], [style,[lines,3,2]], [gnuplot_preamble,"set grid"])$ wxplot2d(ev(Arg_S21(2*%pi*f*1e9)*180/%pi), [f,0.1,20], [legend,false], [xlabel,"Frequency [GHz]"], [ylabel,"S21 (°)"], [style,[lines,3,2]], [gnuplot_preamble,"set grid"])$ wxplot2d(ev(Arg_S22(2*%pi*f*1e9)*180/%pi), [f,0.1,20], [legend,false], [xlabel,"Frequency [GHz]"], [ylabel,"S22 (°)"], [style,[lines,3,2]], [gnuplot_preamble,"set grid"])$ |
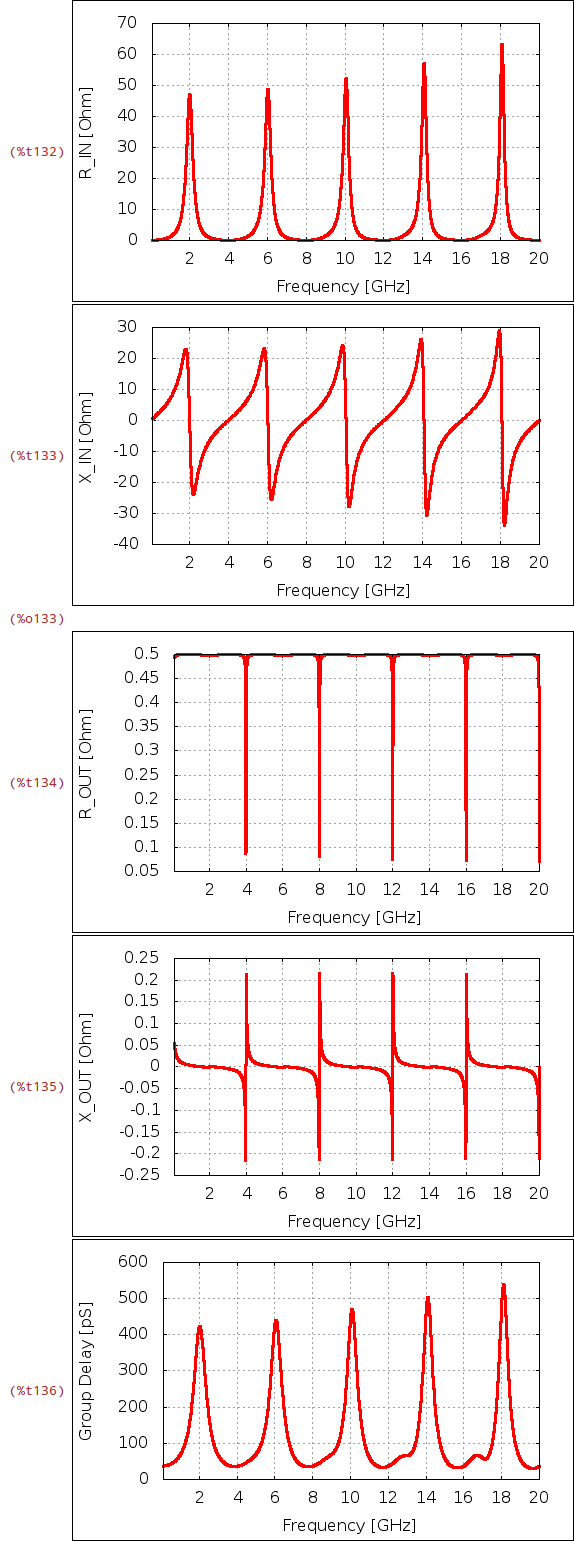
| (%i132) |
wxplot2d(ev((R_IN(2*%pi*f*1e9))), [f,0.1,20], [legend,false], [xlabel,"Frequency [GHz]"], [ylabel,"R_IN [Ohm]"], [style,[lines,3,2]], [gnuplot_preamble,"set grid"])$ wxplot2d(ev((X_IN(2*%pi*f*1e9))), [f,0.1,20], [legend,false], [xlabel,"Frequency [GHz]"], [ylabel,"X_IN [Ohm]"], [style,[lines,3,2]], [gnuplot_preamble,"set grid"]); wxplot2d(ev((R_OUT(2*%pi*f*1e9))), [f,0.1,20], [legend,false], [xlabel,"Frequency [GHz]"], [ylabel,"R_OUT [Ohm]"], [style,[lines,3,2]], [gnuplot_preamble,"set grid"])$ wxplot2d(ev((X_OUT(2*%pi*f*1e9))), [f,0.1,20], [legend,false], [xlabel,"Frequency [GHz]"], [ylabel,"X_OUT [Ohm]"], [style,[lines,3,2]], [gnuplot_preamble,"set grid"])$ wxplot2d(ev((tau_g(2*%pi*f*1e9))*1e12), [f,0.1,20], [legend,false], [xlabel,"Frequency [GHz]"], [ylabel,"Group Delay [pS]"], [style,[lines,3,2]], [gnuplot_preamble,"set grid"])$ |
| (%i137) | kill(%beta,%gamma_TL,c,l,N,R_ON,C_OFF,Z_0); |