/* Put rfMaxima.mac in the same directory as this notebook, or add its
   directory to file_search_maxima. */
load("rfMaxima.mac")$Smith Chart Plotting
Generated from SMITH_CHART.wxm with rfMaxima 0.2.5 on Maxima 5.46.0.
All results were computed by executing the notebook; none is transcribed.
%Gamma(%omega):=(40+%i*%omega*1e-9-50)/(40+%i*%omega*1e-9+50);
PlotSmithChart([
    parametric,
    realpart(%Gamma(%omega)),
    imagpart(%Gamma(%omega)),
    [%omega,2*%pi*1e6,2*%pi*10e9],
    [nticks,1000]]);
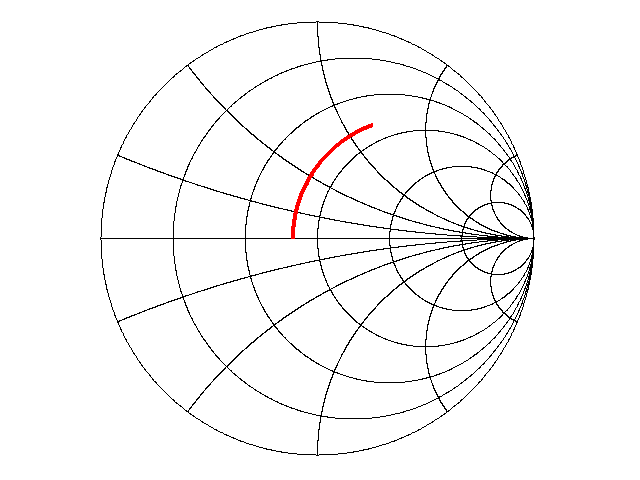
PrintSmithChart([
    parametric,
    realpart(%Gamma(%omega)),
    imagpart(%Gamma(%omega)),
    [%omega,2*%pi*1e6,2*%pi*10e9],
    [nticks,1000]],
    ps,
    "~/SmithChart.eps");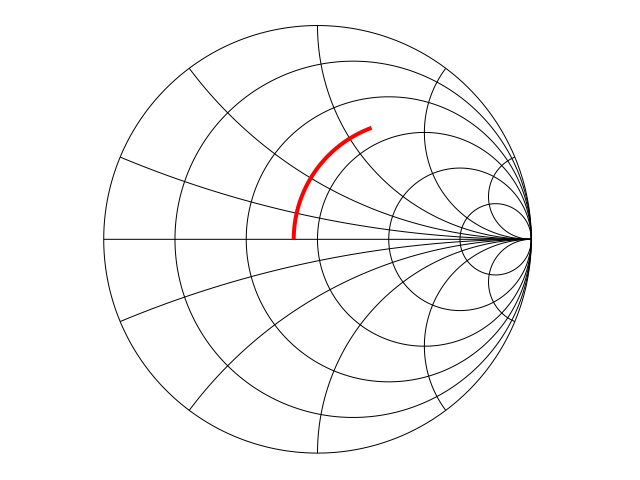
tex1(%Gamma(%omega));